|
<< Click to Display Table of Contents >> 3d_bricks |
  
|
|
<< Click to Display Table of Contents >> 3d_bricks |
|
{ 3D_BRICKS.PDE
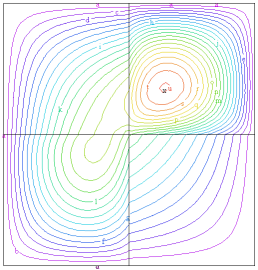
This problem demonstrates the application of FlexPDE to steady-state three dimensional heat conduction. An assembly of four bricks of differing conductivities has a gaussian internal heat source, with all faces held at zero temperature. After a time, the temperature reaches a stable distribution.
This is the steady-state analog of problem
} title 'steady-state 3D heat conduction'
select regrid=off { use fixed grid }
coordinates cartesian3 |
|
variables
Tp
definitions
long = 1
wide = 1
K { thermal conductivity -- values supplied later }
Q = 10*exp(-x^2-y^2-z^2) { thermal source }
initial values
Tp = 0.
equations
Tp : div(k*grad(Tp)) + Q = 0 { the heat equation }
extrusion z = -long,0,long { divide Z into two layers }
boundaries
Surface 1 value(Tp)=0 { fix bottom surface temp }
Surface 3 value(Tp)=0 { fix top surface temp }
Region 1 { define full domain boundary in base plane }
layer 1 k = 1.0 { bottom right brick }
layer 2 k = 0.1 { top right brick }
start(-wide,-wide)
value(Tp) = 0 { fix all side temps }
line to (wide,-wide) { walk outer boundary in base plane }
to (wide,wide)
to (-wide,wide)
to close
Region 2 { overlay a second region in left half }
layer 1 k = 0.2 { bottom left brick }
layer 2 k = 0.4 { top left brick }
start(-wide,-wide)
line to (0,-wide) { walk left half boundary in base plane }
to (0,wide)
to (-wide,wide)
to close
monitors
contour(Tp) on z=0 as "XY Temp"
contour(Tp) on x=0 as "YZ Temp"
contour(Tp) on y=0 as "XZ Temp"
elevation(Tp) from (-wide,0,0) to (wide,0,0) as "X-Axis Temp"
elevation(Tp) from (0,-wide,0) to (0,wide,0) as "Y-Axis Temp"
elevation(Tp) from (0,0,-long) to (0,0,long) as "Z-Axis Temp"
plots
contour(Tp) on z=0 as "XY Temp"
contour(Tp) on x=0 as "YZ Temp"
contour(Tp) on y=0 as "XZ Temp"
elevation(Tp) from (-wide,0,0) to (wide,0,0) as "X-Axis Temp"
elevation(Tp) from (0,-wide,0) to (0,wide,0) as "Y-Axis Temp"
elevation(Tp) from (0,0,-long) to (0,0,long) as "Z-Axis Temp"
end