|
<< Click to Display Table of Contents >> drumhole_animate |
  
|
|
<< Click to Display Table of Contents >> drumhole_animate |
  
|
{ DRUMHOLE_ANIMATE.PDE
*******************************************************************
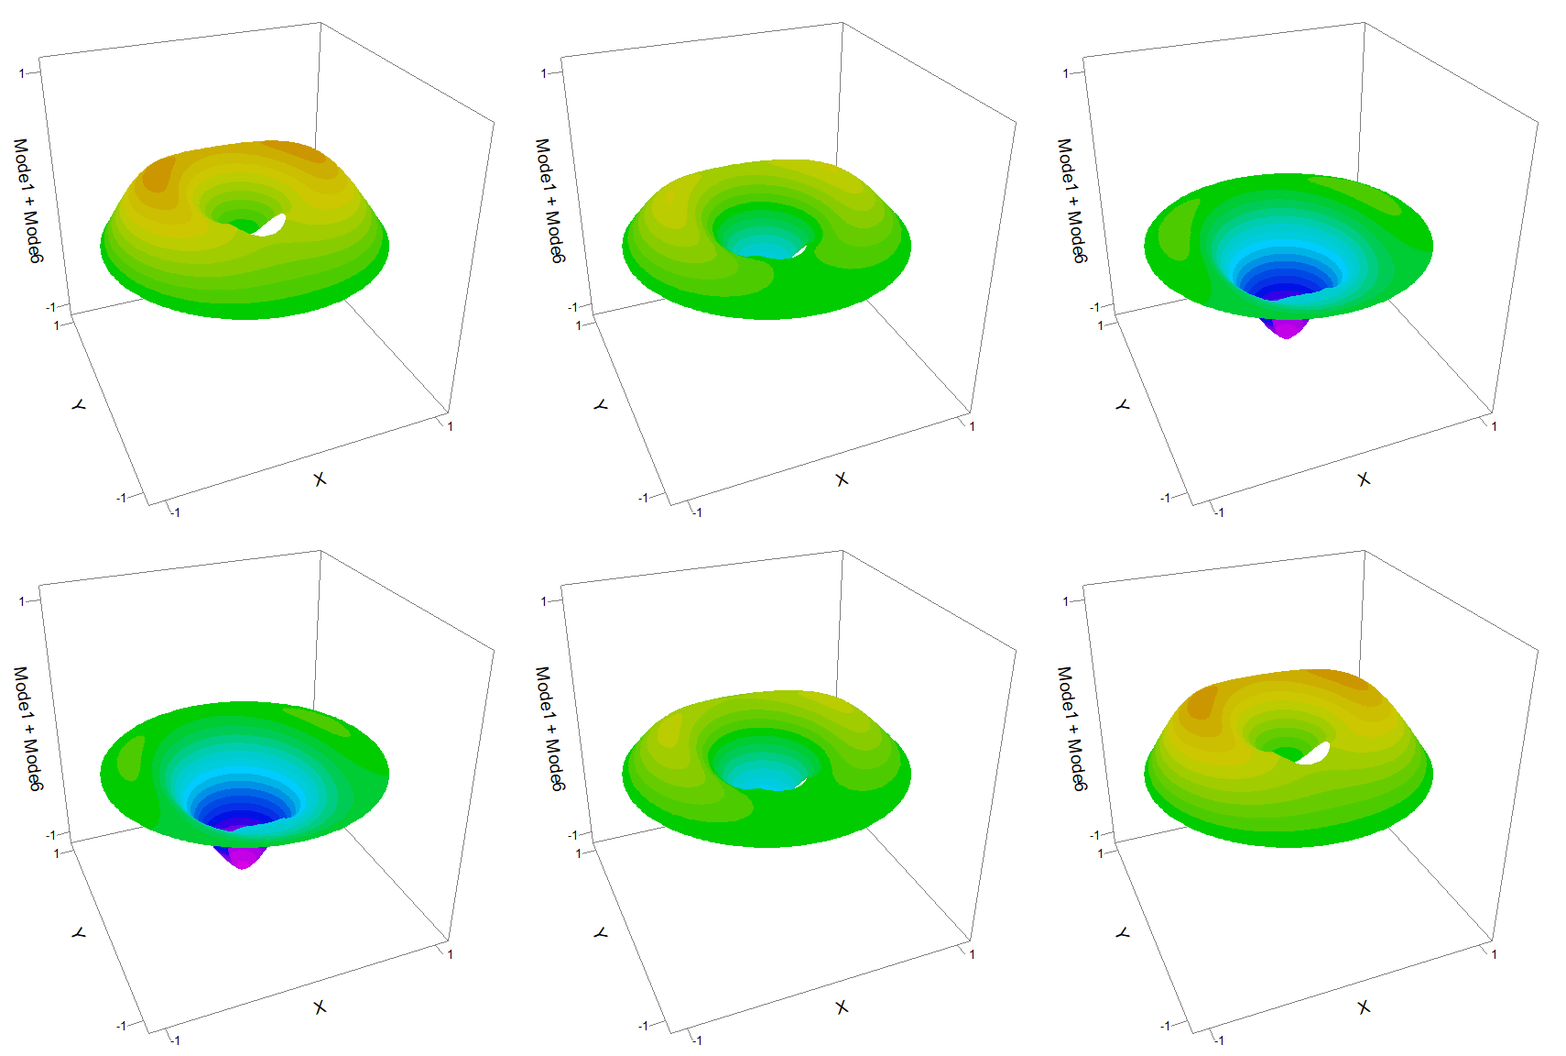
This example reads the stored output from Drumhole.pde
and shows the time-dependent oscillation of the first six modes.
The output .PG8 file can then be opened to export the desired plots using the "View->Export Movie" command.
These plots can be imported to a utility like APNGASM_GUI to create an animated PNG file.
*******************************************************************
}

title "Vibrational modes of a drumhead with a hole"
definitions
! read the transfer files from drumhole.pde
transfer("drumhole_output\ur_mode1",f1,ur1)
transfer("drumhole_output\ur_mode2",f2,ur2)
transfer("drumhole_output\ur_mode3",f3,ur3)
transfer("drumhole_output\ur_mode4",f4,ur4)
transfer("drumhole_output\ur_mode5",f5,ur5)
transfer("drumhole_output\ur_mode6",f6,ur6)
! find the lowest frequency
fmin = min(min(f1,f2,f3),min(f4,f5,f6))
! set the run length and time interval
! Here we have created 50 plots of each mode, spanning one full cycle at the lowest frequency.
t0 = 0
tlast = 2*pi/fmin
tdelt = (tlast-t0)/50
boundaries
! build the plot domain
Region 1
start(0,-1)
arc(center=0,0) angle 360
start(0,-0.4)
arc(center=0,-0.2) angle=360
! define the time range
time t0 by tdelt to tlast
! plot the oscillating drum membranes
plots
for cycle=1
surface(ur1*cos(f1*t)) fixed range(-1,1) report(f1) as "frequency"
surface(ur2*cos(f2*t)) fixed range(-1,1) report(f2) as "frequency"
surface(ur3*cos(f3*t)) fixed range(-1,1) report(f3) as "frequency"
surface(ur4*cos(f4*t)) fixed range(-1,1) report(f4) as "frequency"
surface(ur5*cos(f5*t)) fixed range(-1,1) report(f5) as "frequency"
surface(ur6*cos(f6*t)) fixed range(-1,1) report(f6) as "frequency"
! plot the combined mode 1 and mode 6 oscillation
surface(0.5*ur1*cos(f1*t)+0.5*ur6*cos(f6*t)) fixed range(-1,1) as "Mode1 + Mode6"
end "